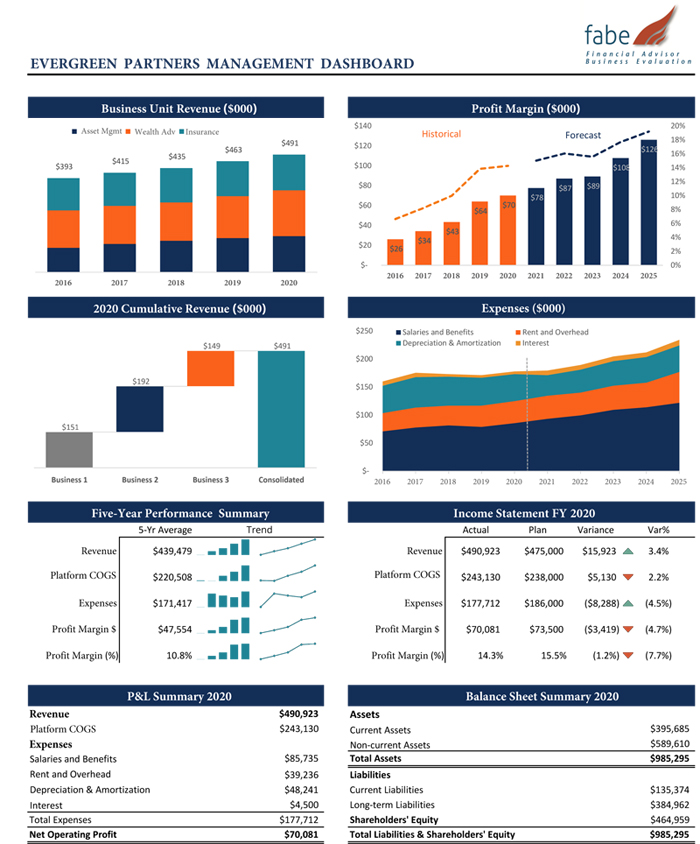
Executive Decisions Making
Countless studies indicate firms utilizing appealing graphs and charts to monitor and display data are more inclined to focus on the data. Our brains find pictures and colors more appealing than spreadsheets. Often times executives need to distill large amounts of complex data quickly to make decisions. Data should be converted to charts and graphs that tell the story of your firm.
Most firms benefit from using interactive dashboards to monitor income, expenses, or products and services.
Profitability Ratios
fabe software calculates over a dozen key ratios allowing for industry comparative analysis
GROSS PROFIT MARGIN
Gross Profit / Total Revenue x 100% = Gross Profit Margin
OPERATING PROFIT MARGIN
Operating Profit / Total Revenue x 100% = Operating Profit Margin
OVERHEAD PERCENTAGE
Total Overhead / Total Revenue x 100% = Overhead Percentage
AVERAGE TOTAL INCOME PER OWNER
Owners Base draw + Operating Profit / # of owners = Average Total Income Per Owner
Productivity Ratios
REVENUE PER ADVISOR PROFESSIONAL (INCLUDES OWNERS)
Total Revenue / # of Professionals = Revenue Per Professional
REVENUE PER STAFF
Total Revenue / # of Total Staff = Revenue Per Staff
HOUSEHOLDS PER ADVISOR PROFESSIONAL
Total Households / # of Advisor Professionals = Households Per Professional
CLIENT HOUSEHOLDS PER STAFF
Total Households / # of Total Staff = Households Per Staff
OPERATING PROFIT PER ADVISOR PROFESSIONAL
Operating Profit / # of Advisor Professionals = Operating Profit Per Professional
OPERATING PROFIT PER STAFF
Operating Profit / # of Total Staff = Operating Profit Per Staff
Client Selection Ratios
REVENUE PER CLIENT HOUSEHOLD
Total Revenue / # of Household Clients = Revenue Per Household
ASSETS UNDER MANAGEMENT PER CLIENT HOUSEHOLD
Assets under management / # of Households = Assets Under Management Per Household
GROSS PROFIT PER CLIENT HOUSEHOLD
Gross Profit / # of Client Households = Gross Profit Per Household
OPERATING PROFIT PER CLIENT HOUSEHOLD
Operating Profit / # of Client Household = Operating Profit Per Client Household
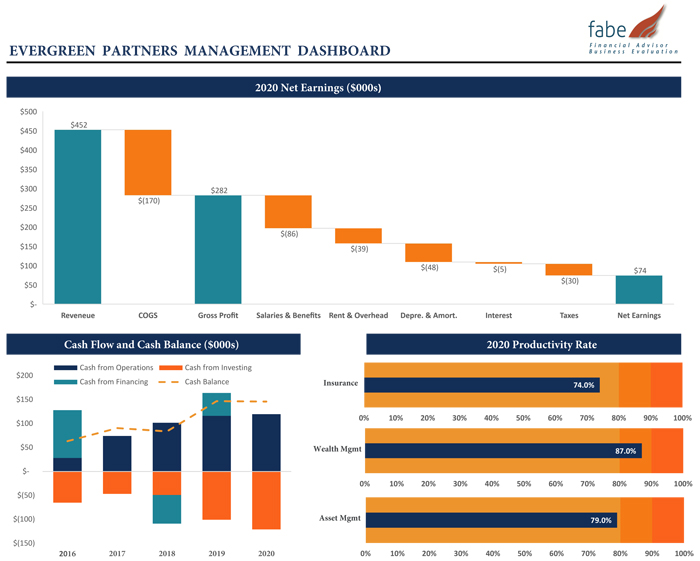
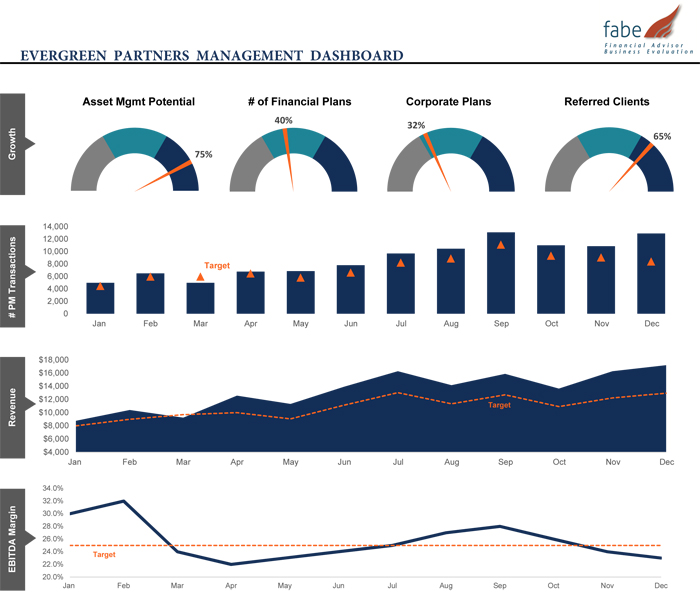
Dashboard Samples